Data sourced from Dakota Private Markets, the private fund performance platform powered by Dakota. Learn More | Request Access
If you've ever looked at a young PE fund's performance and wondered why the numbers look negative, you've seen the J-curve in action. Here's what it is, why it happens, and what to expect.
What the J-curve is
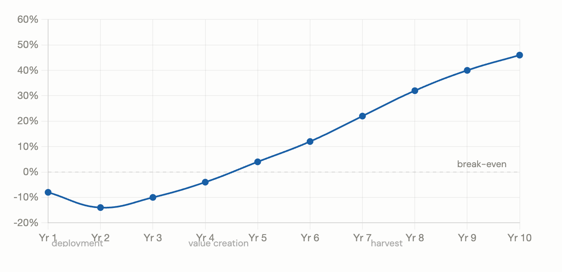
The J-curve describes the typical pattern of returns in a private equity fund over its life. Early on, performance dips into negative territory. Then, as investments mature and get realized, it climbs back up, forming the shape of the letter J.
Why it Happens
Management Fees: Fees are charged from day one, before any investments have had time to appreciate.
Capital Deployment: Capital gets called and put to work, but early-stage investments haven't yet grown in value.
No distributions yet: Exits take time to materialize. DPI is zero or near-zero for the first several years.
How Long Does it Last?
For a typical buyout fund, the trough usually hits somewhere between years one and three. The fund crosses back above zero, called the "zero line", around years three to five, depending on strategy and how quickly capital is deployed.
- Buyout funds: trough in years 1 to 3, recovery by years 4 to 5.
- Venture Capital: J-curve tends to be deeper and longer, VC portfolios take more time to show winners.
- Private Credit: shallower J-curve, since income distributions begin earlier.
- Infrastructure: similar shape to private credit, with a relatively shallow trough. Assets generate cash yield early through contracted revenues, which compresses the dip and accelerates the recovery, typically crossing zero by years 3 to 4.
- Real Estate: J-curve depth depends heavily on the strategy. Core and core-plus funds, with stable income-producing assets, behave more like private credit. Value-add and opportunistic funds carry a deeper, longer curve closer to buyout, since returns depend on repositioning and eventual disposition rather than current income.
A deeper or longer J-curve isn't automatically a bad sign; it depends on the strategy. What matters is the trajectory and what's driving it.
See the J-curve in your own vintage. Dakota Private Markets lets you compare net IRR, DPI, and TVPI across same-vintage, same-strategy funds, so you can see where a trough actually sits instead of estimating it. Request access.
What Allocators Watch For
Experienced LPs don't panic at early negative returns, they expect them. What they watch instead:
- Is the trough getting shallower over successive vintages? That suggests improving capital deployment efficiency.
- Is DPI starting to tick up by years 4 to 5? If not, the recovery may be slower than expected.
- Are subscription credit lines masking the true depth of the J-curve by delaying capital calls?
On that last point: credit facilities have become a standard tool across buyout, infrastructure, and real estate funds. By borrowing at the fund level to fund early investments before calling LP capital, GPs can make the J-curve look shallower and shorter than it actually is. IRR improves because the clock on contributed capital starts later. DPI, however, tells a different story; it's unaffected by when capital was called, which is why allocators increasingly track both metrics together rather than relying on IRR alone.
The question isn't whether a GP uses a credit facility; most do. It's whether the reported early performance reflects genuine value creation or a timing effect that will normalize once the facility is repaid.
Dakota Private Markets
Benchmarking private fund performance is essential for LPs and GPs, but reliable data is often fragmented and expensive. Traditional providers remain core resources, but they often show only part of the picture.
Dakota Private Markets fills that gap with a database of 14,000+ private funds filterable by asset class, sub-asset class, strategy, and vintage year, and uniquely, by the sector and industry of the underlying portfolio companies. Across 5 asset classes, you can compare funds on net IRR, DPI, and TVPI alongside allocator insights, company intelligence, and deal flow data, all in one platform.
In a competitive market, understanding not just how funds perform, but why they perform, is what separates good decisions from great ones. Dakota Private Markets delivers that complete view.
See where a fund actually stands. Dakota Private Markets standardizes net IRR, DPI, and TVPI across strategy and vintage, so the comparison you bring to an allocator is one you built rather than one you inherited. Request access.