Data sourced from Dakota Marketplace, the global LP and GP intelligence platform trusted by thousands of investment professionals. Learn More | Book a Demo
Two funds can quote the same 15% headline return and hand back very different dollar amounts to their investors. A drawdown fund at 15% net IRR turns $100 into $216 over ten years. An evergreen fund at 15% net CAGR turns the same $100 into $405.
Both numbers are honest. The gap comes from how each structure puts money to work, and understanding that gap is the whole point of comparing the two.
Across 450+ evergreen funds we track through Dakota Marketplace, including 100+ vehicles no prior database had identified as evergreen, we see fund managers, advisors, and LPs asking the same question: how do these two structures actually compare, and when should each be used?
In this article, we walk through the structural differences between evergreen and drawdown funds, the math that explains why identical headline returns produce different dollar outcomes, and the trade-offs that determine when each vehicle fits.
Two Structures, Two Playbooks
Evergreen and drawdown funds are built on the same underlying private markets, but the wrappers around those assets differ in almost every material respect. The mechanics affect who can invest, how much capital is actually at work, how tax reporting flows, and how performance gets measured.
The Structural Differences
The nine-feature comparison below is the fastest way to see how far apart the two structures sit.
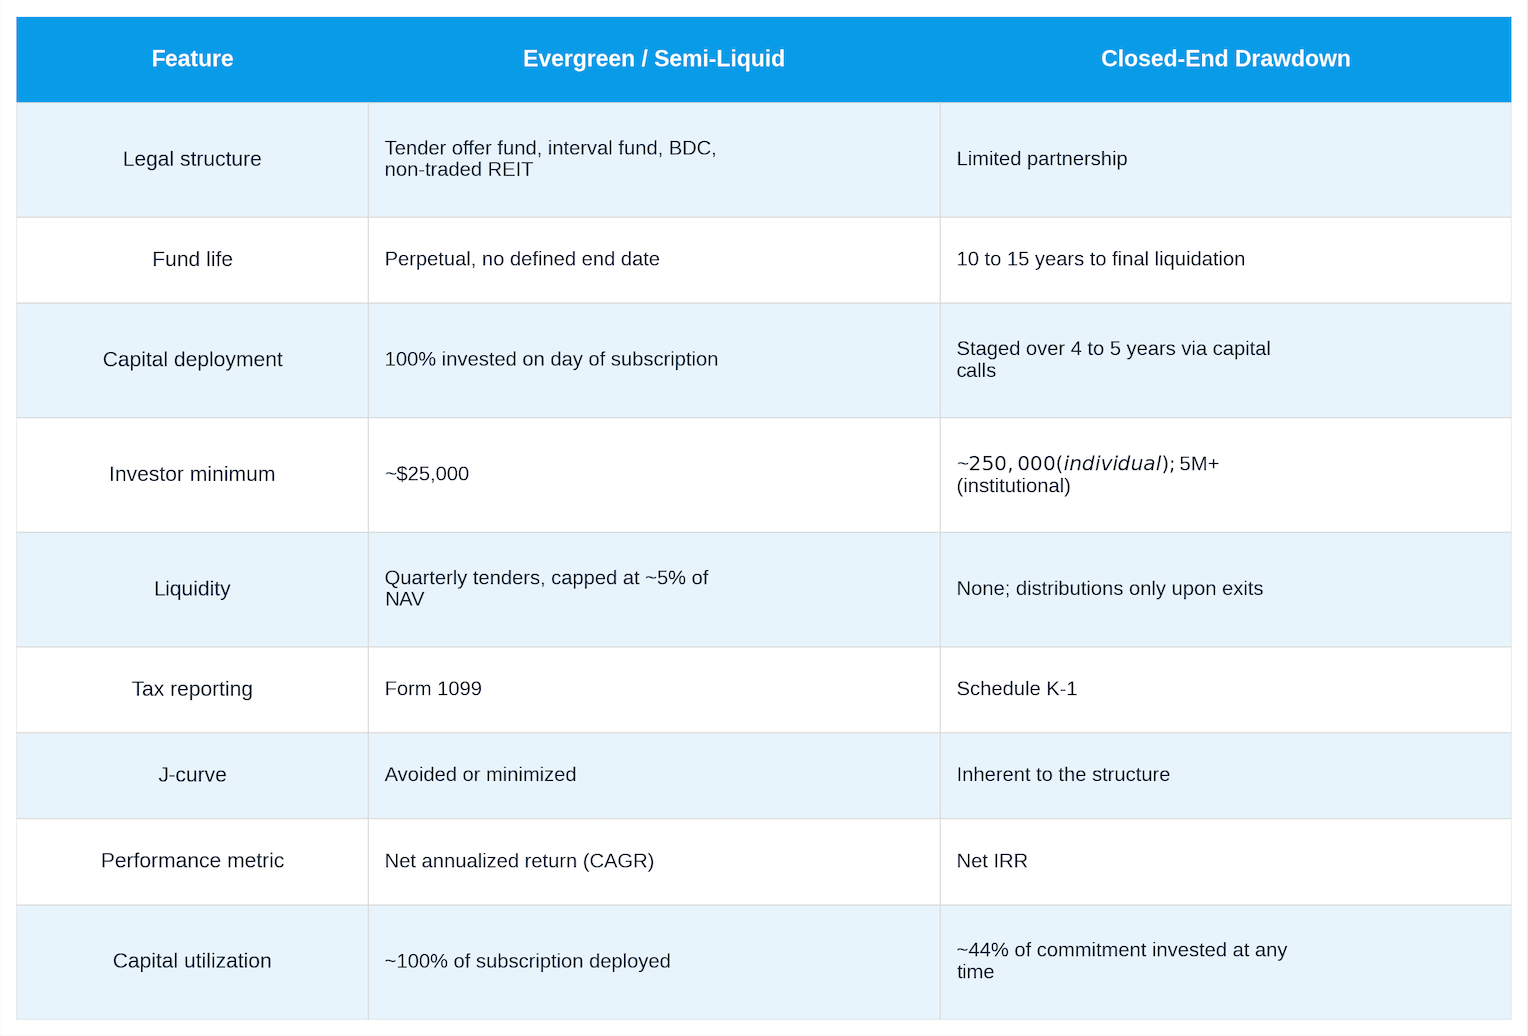
The two most consequential rows are capital deployment and liquidity. A drawdown fund calls capital in tranches over four to five years and returns it in years five through ten, which means only a portion of the investor's commitment is at work at any given time. Industry research estimates that only about 44% of committed capital is invested in a typical drawdown fund at any given moment. An evergreen fund, in contrast, puts 100% of the subscription to work on day one and keeps it there. Proceeds from any asset sale are reinvested rather than returned. The rest of the table follows from those two decisions.
How Capital Flows Through Each
In a drawdown fund, the investor commits a dollar amount, say $1 million. The manager calls that capital over four to five years as deals close, so the investor's actual cash position moves through several phases: uncommitted, called-and-deployed, held-at-work, and eventually distributed back. The mental model is a schedule of cash flows out and cash flows in, with the peak of invested capital sitting somewhere in year three or four.
In an evergreen fund, the investor subscribes with $1 million and $1 million is invested on the day of subscription. There are no capital calls, and when the manager sells an asset, the proceeds are reinvested rather than returned. The mental model is a single deposit that compounds continuously until the investor requests a redemption. That structural difference is what generates almost every other consequence downstream, from the return math to the tax treatment to the accessibility of the wealth channel.
The Return Math Is Different
Drawdown funds report performance as an internal rate of return. Evergreen funds report performance as a compound annual growth rate. These are not the same metric, and comparing them directly is where most misunderstandings start.
IRR vs. CAGR
IRR measures the return on capital while it is actually at work. CAGR measures the annualized growth of a single deposit over its full holding period. Because uncalled capital sits in cash during a drawdown fund's early years, and because distributions come back out of the fund in later years, the money in a drawdown fund earns its IRR on a shrinking base for much of the fund's life. In an evergreen fund, the full deposit compounds without interruption.
The dollar consequence is significant. A $100 investment in a drawdown fund reporting 15% net IRR ends the ten-year holding period at roughly $216, a $116 gain. The same $100 in an evergreen fund reporting 15% net CAGR ends at roughly $405, a $305 gain. Neither manager is misreporting. The difference is entirely explained by how much of the committed capital was actually earning the reported rate, and for how long.
The breakeven math is the useful frame:
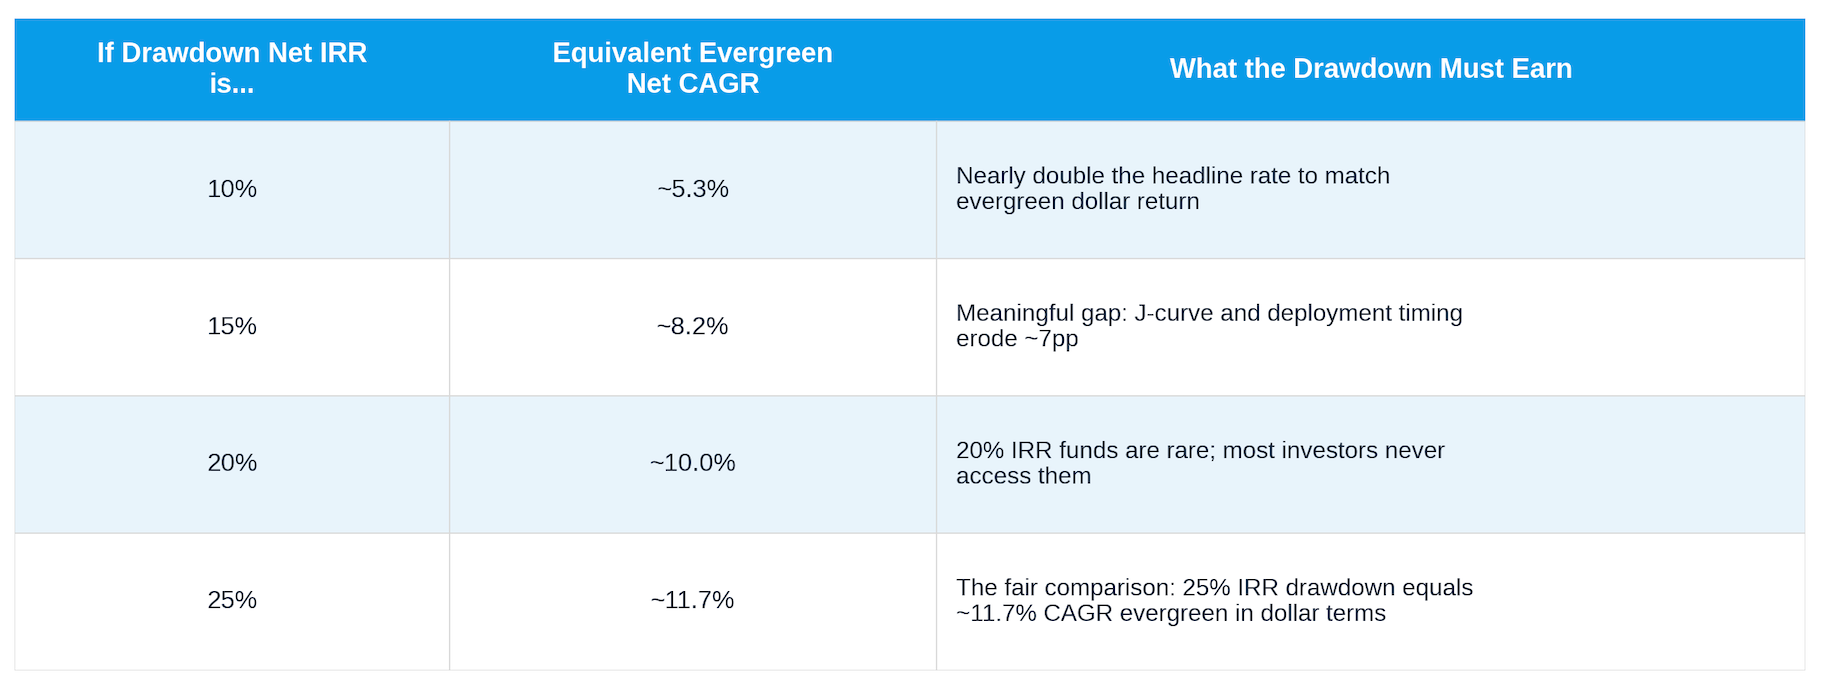
Assumes uncalled capital earns 7% in a public equity proxy. Source: Ares Management, Evaluating Evergreens, 2025.
A drawdown fund needs to hit a 25% net IRR to match an evergreen returning 11.7% net CAGR on a dollar-in, dollar-out basis. Top-quartile drawdown managers do reach those numbers, but the comparison requires more nuance than most investors apply when they see two headline figures side by side.
MOIC vs. MOCC
The same issue shows up in multiples. Multiple on invested capital, or MOIC, measures how the dollars that were actually deployed performed. A fund that calls half of a $100 commitment and doubles it reports a 2.0x MOIC. But the investor's dollar-in, dollar-out multiple is 1.5x, because the other half of the commitment sat in cash for most of the fund's life. Multiple on committed capital, or MOCC, measures what happened to every dollar the investor committed, including the portion that sat in cash. It is the more honest benchmark when comparing across structures, and it is one of the reasons evergreen performance often looks more competitive than headline comparisons suggest.
See every evergreen fund, sponsor, and strategy in one place. Book a demo of Dakota Marketplace for access.
When Each Vehicle Fits
Neither structure is universally better. Both wrap the same underlying private markets, and both have specific investor profiles they serve well. The right question is not which structure wins in the abstract, but which one fits the investor sitting across the table.
Where Evergreens Fit
Evergreens were built for continuous access and operational simplicity. That makes them the natural vehicle for wealth channel investors, family offices below the institutional threshold, and retirement plan structures that need daily NAV pricing and 1099 tax reporting. A $25,000 minimum, no capital calls, and periodic liquidity solves the practical problems that kept traditional drawdowns out of these channels for decades. It is why the U.S. evergreen market has grown from $46 billion to over $500 billion in a decade, with new fund filings now running at more than one per business day.
The math also favors evergreens for investors who value compounding over deployment control. If the alternative is committing $250,000 to a drawdown fund and holding cash on the sidelines waiting for capital calls, the evergreen structure captures the compounding advantage automatically.
What Evergreens Give Up
Evergreens are not without trade-offs, and those trade-offs matter most for sophisticated institutional investors. A large drawdown fund can access co-investment allocations, negotiate fee terms with the GP, and control its vintage-year exposure in ways that an evergreen investor cannot. The evergreen investor accepts the manager's allocation of the fund's capital across strategies, deal types, and vintages. For an institutional LP with a large book and a long time horizon, giving up those levers may cost more than it saves.
Liquidity is the other conditional feature to understand. An evergreen fund offers quarterly redemptions capped at approximately 5% of NAV, which works in normal conditions but can be prorated or gated in stress scenarios. Q1 2026 was a live example: four major evergreen funds received $5.4 billion in redemption requests and honored $2.1 billion, exactly as their offering documents allowed. Investors who need certainty of liquidity are better served by public market exposure or shorter-duration credit vehicles.
For a fuller look at how these structural questions play out across the current evergreen market, see our May 2026 Evergreen Market Landscape report.
Tracking the Pipeline
We track every N-2 filing, share class launch, and sponsor partnership across 450+ evergreen funds in Dakota Marketplace, including 100+ vehicles no prior database had identified as evergreen.
Every record is sourced from public regulatory filings and standardized across private equity, private credit, real estate, and hybrid strategies. Filter by sponsor, strategy, AUM, or filing date to compare vehicles against a consistent benchmark.
Book a demo of Dakota Marketplace for access.