Plans above $25B average roughly 37% of their portfolios in alternatives. That figure is up from 10-15% in 2005, and it now sits at the center of how the largest pools of institutional capital in the country invest.
But the headline number hides what actually matters for anyone raising a private markets fund: the allocation curve is steeply tied to plan size, it has flattened at the top, and the growth is now coming from a different part of the market than it was five years ago.
Dakota tracks over 800 U.S. public pension plans and $9 trillion in combined AUM in our institutional investor database, Dakota Marketplace, including current allocation data on plans across every size tier. The figures below are drawn from our US Public Pensions, A to Z report.
Here's what that data says about how much public pensions actually allocate to alternatives, and what those numbers mean for your fundraise.
The Short Answer
Across a sample of 128 plans spanning the universe, the average allocation breaks down like this:
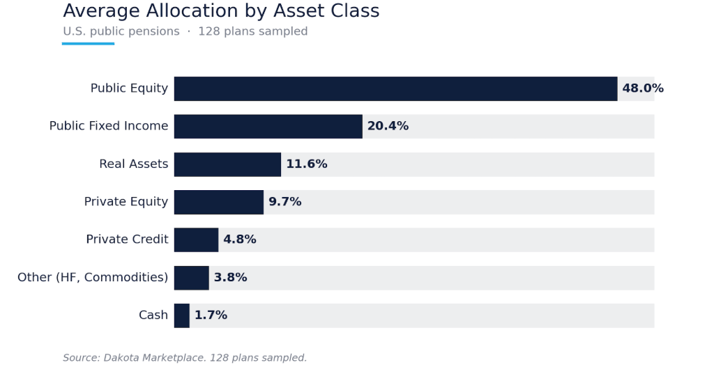
Defining alternatives as private equity, private credit, real assets, and other, the average public pension allocates roughly 30% to alternatives across the full universe.
But that system-wide average is misleading on its own, because the number you should care about depends entirely on the size of the plan you're calling. Public pensions have continued building these allocations even through the rate reset.
Alternatives Allocation Scales With Plan Size
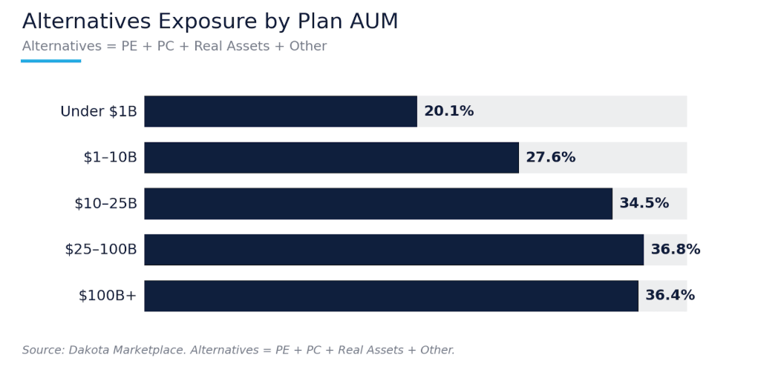
The relationship between plan size and alternatives exposure is the single most useful pattern in the data. Here's how it looks by AUM tier:
Two things stand out.
First, the relationship is not linear. The biggest single jump (+7.5 percentage points) happens between the under-$1B tier and the $1-10B tier. That boundary is where plans begin running institutional-quality private markets programs, and it's the most important line in the table for fund managers.
Second, alternatives exposure plateaus above $25B. The $25-100B tier sits at 36.8% and the $100B+ tier actually ticks down slightly to 36.4%. The mega-allocators are not allocating a higher percentage to alternatives than the merely large plans. They're deploying more dollars because their base is bigger, but on a percentage basis the top of the market has settled at around 37%.
Why the Largest Plans Stop at ~37%
The plateau isn't an accident. It reflects a hard constraint on how much illiquidity even the most sophisticated plans will carry.
Plans with significant alternatives programs have to maintain enough liquid assets to cover benefit payments, rebalancing, and opportunistic deployment without becoming forced sellers. That's why even the most alternatives-heavy plans rarely push beyond 50-55% in illiquid assets, and why unfunded commitments get tracked as carefully as NAV exposure. The 37% average leaves room for that liquidity buffer.
The post-2022 denominator effect made the constraint concrete. When public markets drew down, alternatives' share of total portfolios inflated automatically, and several large plans had to pause new commitments or slow pacing to stay within their illiquidity limits. Some used the secondary market to sell down exposure rather than simply waiting it out. The 37% ceiling is what disciplined liquidity management looks like in practice.
Want to see allocation data on the specific plans you're targeting? Our institutional investor database tracks current asset allocation by plan, broken out by AUM tier, asset class, and fiscal year-end. Book a demo of Dakota Marketplace.
Adoption Varies Widely by Asset Class
The aggregate alternatives number also obscures how unevenly the individual asset classes are adopted. Three patterns are worth knowing before you build a target list:
- Real assets is the most universally held alternative. Only 2% of plans have zero exposure. If you're raising a real assets or private real estate fund, the question is rarely whether a plan allocates to the category, but how much.
- Private credit is still a partial-adoption asset class. 37% of plans hold no private credit at all, even though it's now the second-largest alternatives category by disclosed capital among adopters. That unallocated third is the clearest open runway in the system.
- Private equity is broadly adopted but the median allocation is still just under 10%. It's the most established private markets allocation, which means it's also the most competitive to win.
Public equity dispersion tells the same story from the other side. Allocations range from 20% at a private-markets-heavy fund like Oregon PERF to over 90% at the most liquid plans. There is no single "typical" public pension portfolio, only a distribution that tracks size and sophistication.
What This Means for Your Fundraise
If you're raising a private markets fund, the allocation data points to a clear targeting strategy.
The mid-market is where the growth is. The marginal increase in alternatives deployment is no longer the mega-allocators scaling existing programs. It's plans in the $1-10B range building first-generation alternatives allocations, often through OCIO structures or upgraded consultant relationships. A $3B plan standing up its first private credit sleeve is a more open door than a $100B plan that filled its core relationships years ago. For emerging managers especially, the emerging manager programs at public pensions are often the most direct entry point into these plans.
Match your asset class to its adoption curve. A real assets manager is selling into near-universal adoption and competing on terms. A private credit manager has a third of the universe sitting at zero and scaling adopters to pursue. A private equity manager is entering the most crowded category and needs a sharper differentiator.
And remember that percentage targets translate to very different dollar figures by tier. A 37% alternatives allocation at a $100B plan is a fundamentally different mandate than the same percentage at a $2B plan, in ticket size, decision process, and the consultant standing between you and the commitment.
Find the Plans That Fit Your Strategy
The 37% headline is the start of the conversation, not the answer. The allocation that matters is the one at the specific plan you're calling, filtered by the asset class you're raising and the size tier you can realistically win.
Our institutional investor database tracks over 800 U.S. public pension plans with current allocation data, AUM tiers, consultant relationships, and CIO contacts. Filter by alternatives exposure, asset class focus, plan size, or fiscal year-end to build a targeted list in minutes instead of weeks. Book a demo of Dakota Marketplace.