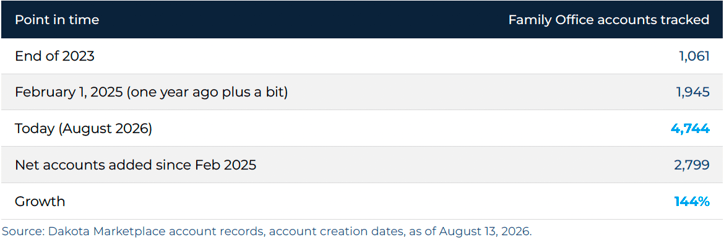
Eighteen months ago, on February 1, 2025, Dakota Marketplace tracked 1,945 Family Office accounts. Today that number is 4,744, a 144% increase. Unlike some of Dakota's other datasets, Family Office coverage did not start from zero. It started from a real base and simply kept building, quarter after quarter, without a single flat period.

The growth, start to finish
The curve shows why this is a genuinely different shape than Dakota's fund or transaction databases: there is no dead period. Coverage moved from roughly 1,100 accounts at the end of 2023 to nearly 4,700 today, with the growth rate itself accelerating through 2025 and into 2026.
The Curve — Two inflection points, no dead period — Cumulative Family Office accounts tracked
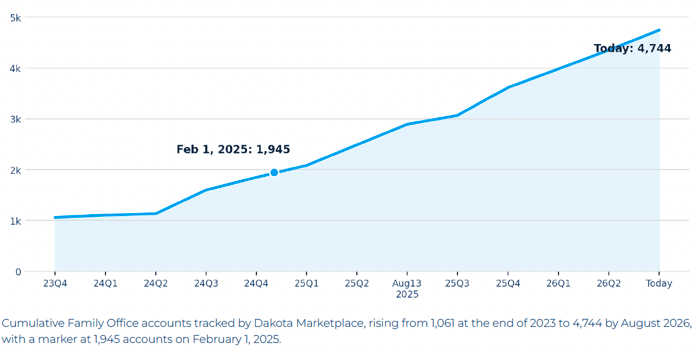
Two inflection points stand out. The first came in mid-to-late 2024, when the account base jumped from 1,135 to 1,849 in two quarters, roughly 63% growth in six months. The second, and larger, came across 2025 into 2026: the database more than doubled again, adding 2,660 accounts in the twelve months from Q3 2025 through today.
2,799 offices you did not have last year
Family Office coverage has grown every quarter with no flat period, and the rate is still climbing. Book a demo to see the current 4,744 →
Geography — Where the growth is coming from
Family Office coverage has broadened geographically, not just deepened in existing markets.
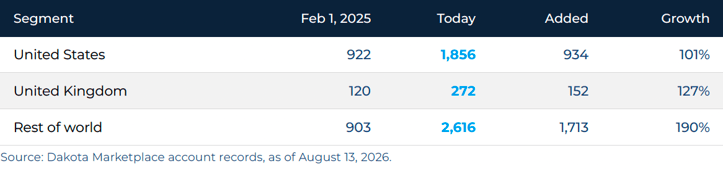
The US and UK, Dakota's most established Family Office markets, both roughly doubled. The rest of the world nearly tripled, growing faster than either. Eighteen months ago, US and UK accounts made up 54% of all Family Office coverage; today they make up 45%. The center of gravity has shifted outward.
The newest accounts are not in the US or UK
Rest-of-world coverage nearly tripled and now holds accounts, more than the US and UK combined. Book a demo to filter by geography →
Size distribution tells a second story
Splitting the base by AUM shows the growth is concentrated below the largest tier.

Below the $1B tier is where the volume is
2,691 of 2,799 new accounts sit under $1B or have AUM not yet captured. Book a demo to filter by AUM band →
Size Distribution — Wider before larger
The largest, most institutional Family Offices grew the slowest, 27% over eighteen months, simply because there are only so many multi-billion-dollar single-family operations to add. Almost all of the net growth, 2,691 of the 2,799 new accounts, came from smaller and mid-size Family Offices, plus a share of accounts where AUM has not yet been captured. Dakota's Family Office coverage grew wider well before it grew any larger at the top end.
What this means for anyone using the data
Family Office is now one of Dakota's largest allocator segments by growth rate. A 144% increase in eighteen months outpaces steady, mature categories and reflects active, ongoing expansion, not a one-time backfill.
Non-US, non-UK Family Offices are the fastest-growing slice. If your outreach or research has been US/UK-centric, the newest 1,700-plus accounts sit largely outside those two markets.
Expect more small and mid-size offices, not more mega-family offices. The $1B+ tier grew modestly. Most of the new coverage is in the broader, less institutionalized part of the market, which typically means less publicly documented but often still highly influential wealth pools.
This is an active build, not a settled dataset. Given the pace has not slowed through six consecutive quarters, treat current totals as a snapshot of a still-moving target rather than a finished count.
Find the family offices behind the growth
Dakota Marketplace tracks 4,744 Family Office accounts globally, spanning single and multi-family offices, family-owned holding structures, and family investment vehicles across every major wealth market.
Filter by AUM, geography, investment focus, and asset class exposure, then connect directly to the decision-makers behind each family's capital.
Book a demo »



