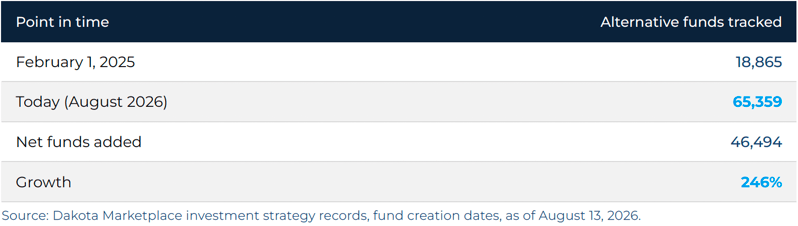
Eighteen months ago, Dakota Marketplace tracked 18,865 alternative investment funds, and almost none of them had performance data attached. Today that fund count stands at 65,359, and 18,000 of those funds now carry real performance histories: net IRR, TVPI, DPI, and quarter-by-quarter return data going back, in some cases, to 2000.

That is not one growth story. It is two, running on top of each other, and the gap between them is the more interesting number.
The Fund Universe: from 18,865 to 65,359
Dakota Marketplace's alternative fund database (private equity, private credit, private real estate, private infrastructure, real assets, venture capital, hedge funds, multi-asset, and a handful of smaller sleeves) has more than tripled since February 2025.
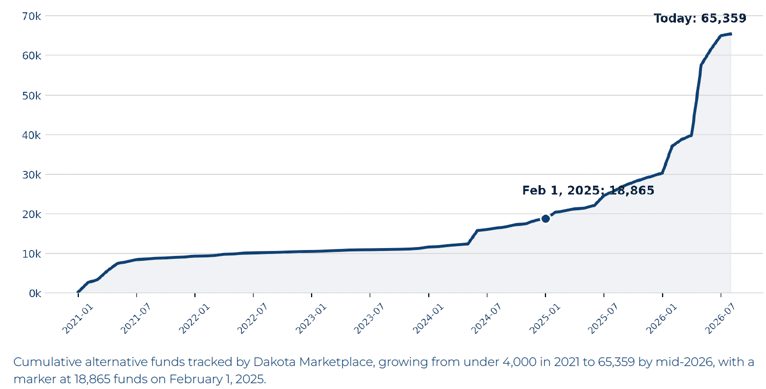
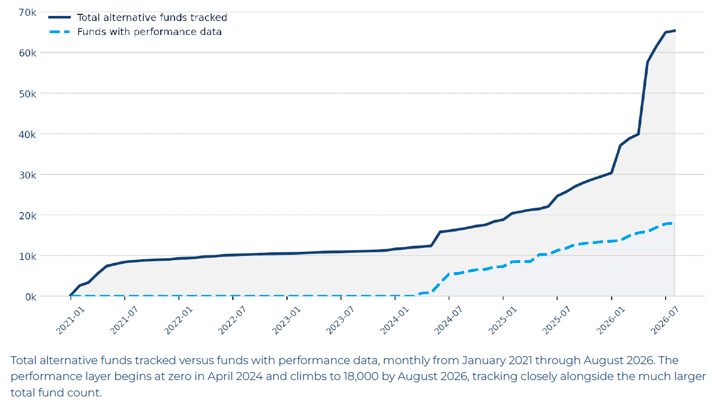
That growth was not a straight line. It was flat for most of 2022 and 2023, picked up through 2024 and early 2025, and then accelerated hard, adding more funds in the first seven months of 2026 than in the previous four years combined.
Additions By Asset Class
By asset class, the additions are concentrated but not evenly so:
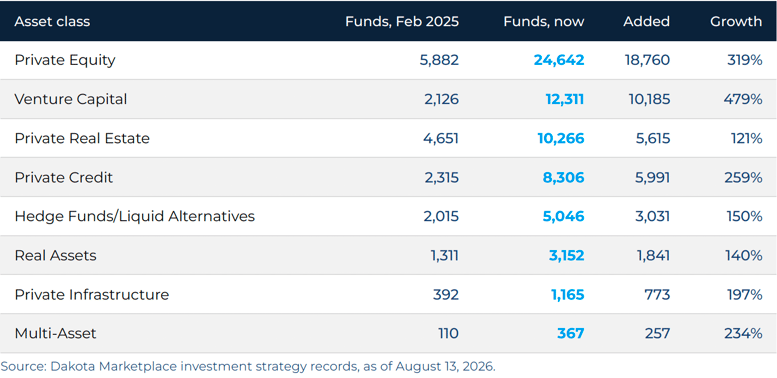
Venture Capital grew the fastest by percentage, nearly quintupling. Private Equity added the most funds in absolute terms, accounting for about 40% of every new fund added to the database since last February.
SCREEN THE CURRENT UNIVERSE
46,494 funds have been added since February 2025, so a list built last year is already out of date. Book a demo to screen the full 65,359 →
Four flat years, then a step change
Cumulative alternative funds tracked
The second story: performance data starting from zero
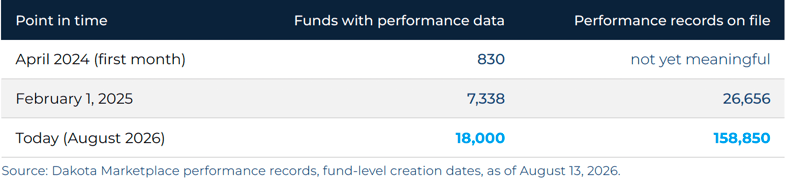
Here is where it gets more specific. Dakota did not have any performance records on these funds until April 2024. The first 830 funds got performance data that month. By February 2025, that number was 7,338. Today it is 18,000, backed by 158,850 individual performance records (each one a fund reporting for a specific quarter).
COVERAGE WHERE IT COUNTS
The headline 28% hides wide variation by asset class, so the only rate that matters is the one for your strategy. Book a demo to see coverage for yours →
The Two Curves — Putting the two curves together
The ratio matters as much as the totals. Each of the 18,000 funds with performance data carries an average of 8.8 separate performance records, meaning Dakota is not just adding funds to the performance layer once and stopping. It is going back and building out history, quarter by quarter, for funds already in the system.
Overlaying fund count against performance-covered fund count shows something a single growth number would hide: the performance layer has been catching up to the fund universe, not falling further behind it, even while the fund universe itself was tripling.
In February 2025, 7,338 of 18,865 tracked funds had performance data, a coverage rate of 39%. Today, 18,000 of 65,359 funds have performance data, a coverage rate of 28%. Overall coverage dropped because the fund universe grew faster than the performance layer could keep pace, which is exactly what you would expect when a database triples in eighteen months. The more telling number is the performance layer's own growth: 145% since February 2025, against 246% for total funds. It is not far behind.
Total funds tracked versus funds with performance data
Coverage By Asset Class — Where performance depth actually lives
Coverage is wildly uneven by asset class, and the pattern is not what raw fund counts would predict.
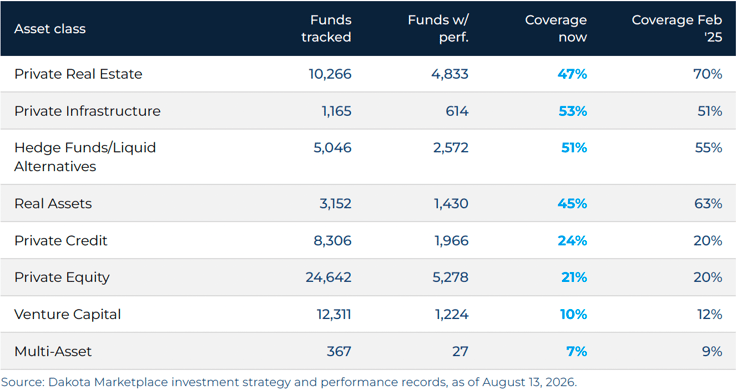
Private Real Estate and Real Assets both show coverage rates falling, from 70% to 47% and from 63% to 45% respectively, not because Dakota stopped adding performance data (real estate performance funds grew 48% over the period), but because the underlying fund count in those categories grew even faster. Private Equity and Private Credit, by contrast, held or slightly improved their coverage while both layers grew fast together: Private Equity performance-covered funds grew 352%, just above the fund universe's 319% growth in that same category.
Venture Capital is the clearest outlier. It is the fastest-growing asset class by fund count (479% growth) and one of the thinnest for performance coverage (10%). VC funds get added to Dakota Marketplace quickly. Performance histories on those funds take longer to build, which tracks with how illiquid, infrequently-marked venture portfolios typically report.
The Takeaway — What this means for fund managers and data users
The practical read depends on what you are trying to do with the data.
If you are screening by asset class or vintage, the universe is broad and current. The fund side of Dakota Marketplace has kept pace with a fast-moving market, adding tens of thousands of new funds in eighteen months.
If you need performance benchmarking, Private Real Estate, Hedge Funds, and Private Infrastructure are the deepest categories today, each with performance coverage above 45%. Private Equity and Private Credit are the largest absolute performance datasets (5,278 and 1,966 funds respectively) even though their coverage percentage is lower, simply because the fund universe in those categories is so much larger.
Venture Capital performance data is the newest and thinnest layer. Coverage sits at 10% today. If your work depends on VC fund performance history specifically, expect gaps, and expect that gap to close over the next several quarters as the same build-out pattern seen in Private Equity extends into venture.
KNOW THE GAPS BEFORE YOU RELY ON THEM
Coverage moves every month, so the honest answer for your asset class is the current one, not last quarter's. Book a demo to check it live →
Find the funds and the performance behind them
Dakota Marketplace tracks 65,359 alternative investment funds across private equity, private credit, real estate, infrastructure, real assets, venture capital, and hedge funds, with performance histories now built out for 18,000 of them and growing every month.
Filter by asset class, vintage, fundraising status, and performance metrics including net IRR, TVPI, and DPI, then connect the coverage directly to the manager relationships behind each fund.
Book a demo »



