Last update we took a very high-level look at the asset class level filings and dollar flows into ETFs during Q4. Despite 2022’s volatility, equities maintained the majority share of ETF asset classes at 68% VS fixed and commodities.
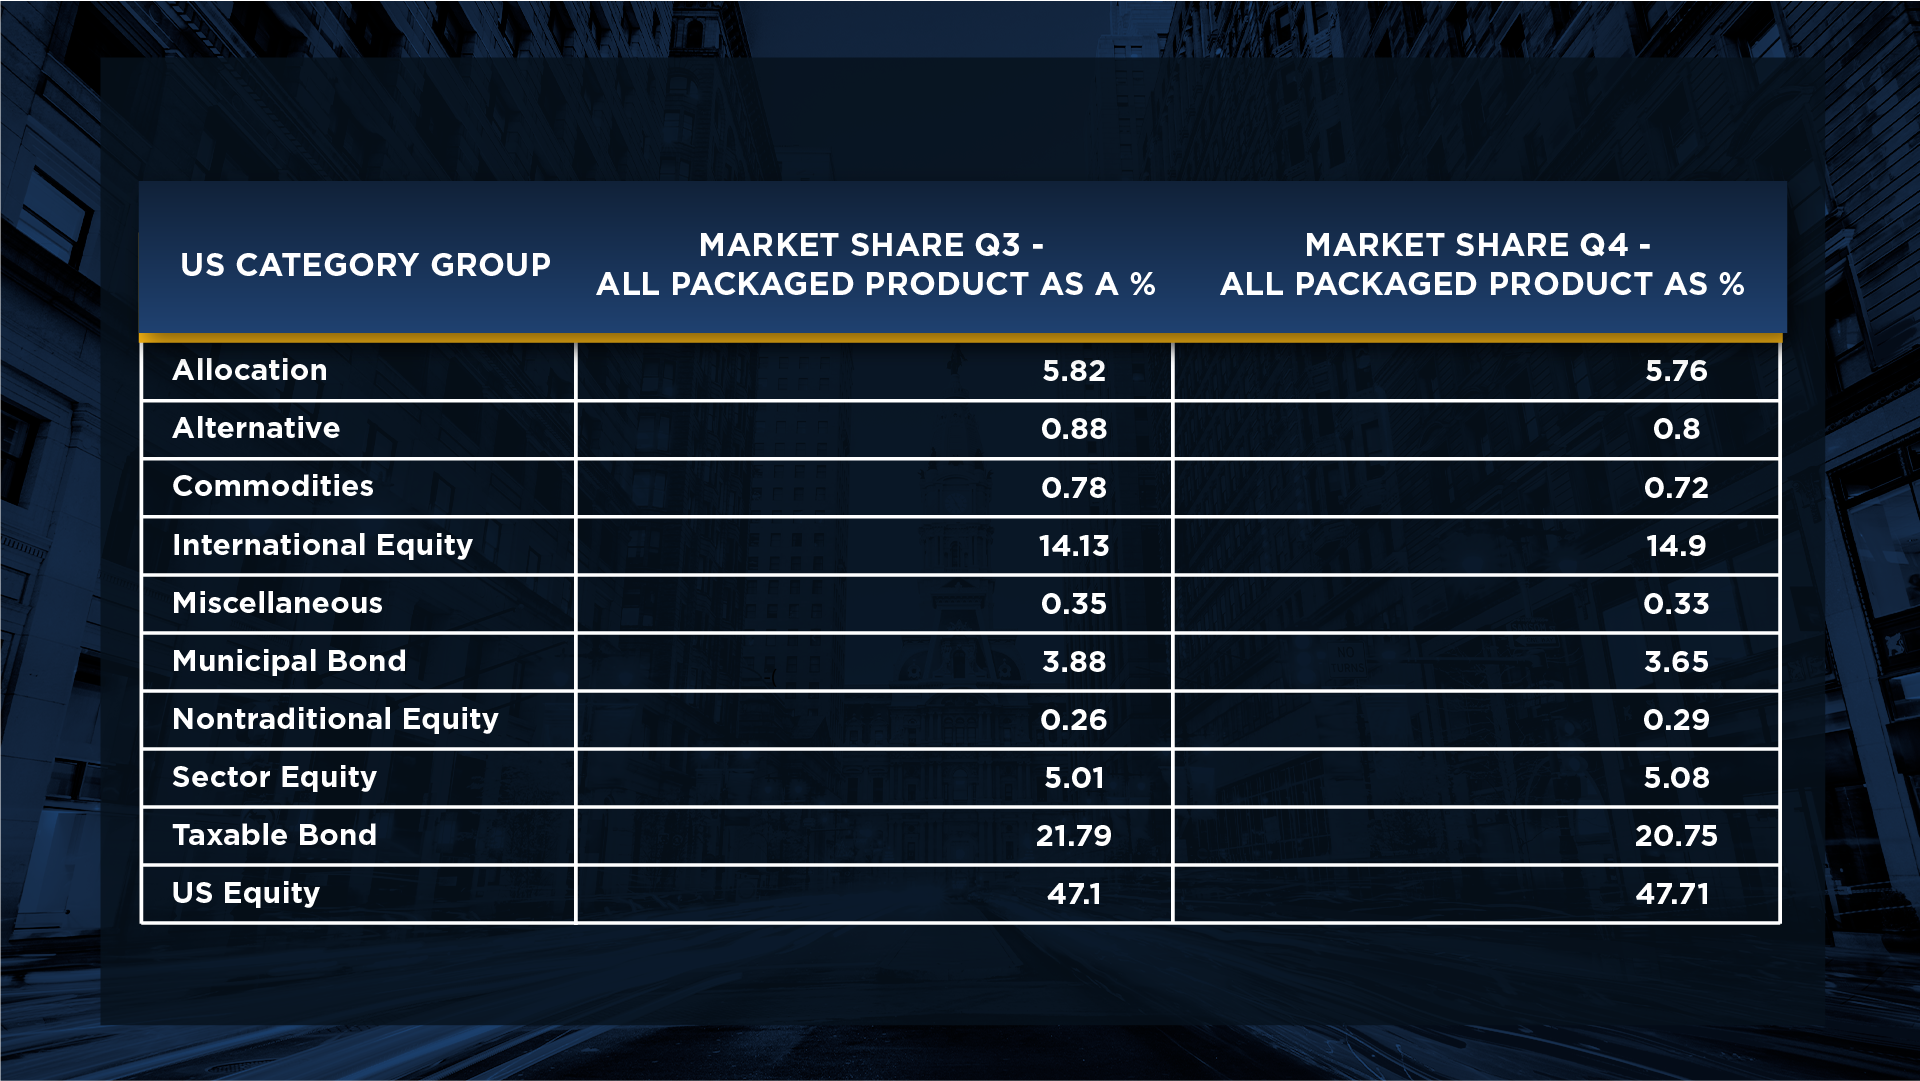
Once we peel back a layer on funds VS ETFs however, the data showed divergent trends which tells us that structure has in fact been impacting flows and is an input in how allocators have been building portfolios during Q4.
An example of this was in US equities during Q4, the mutual fund flows showed sizeable outflows during the quarter however the flows into US equities via ETFs more than made up for this and meant a net-positive for the quarter by over $20 B in net flows:
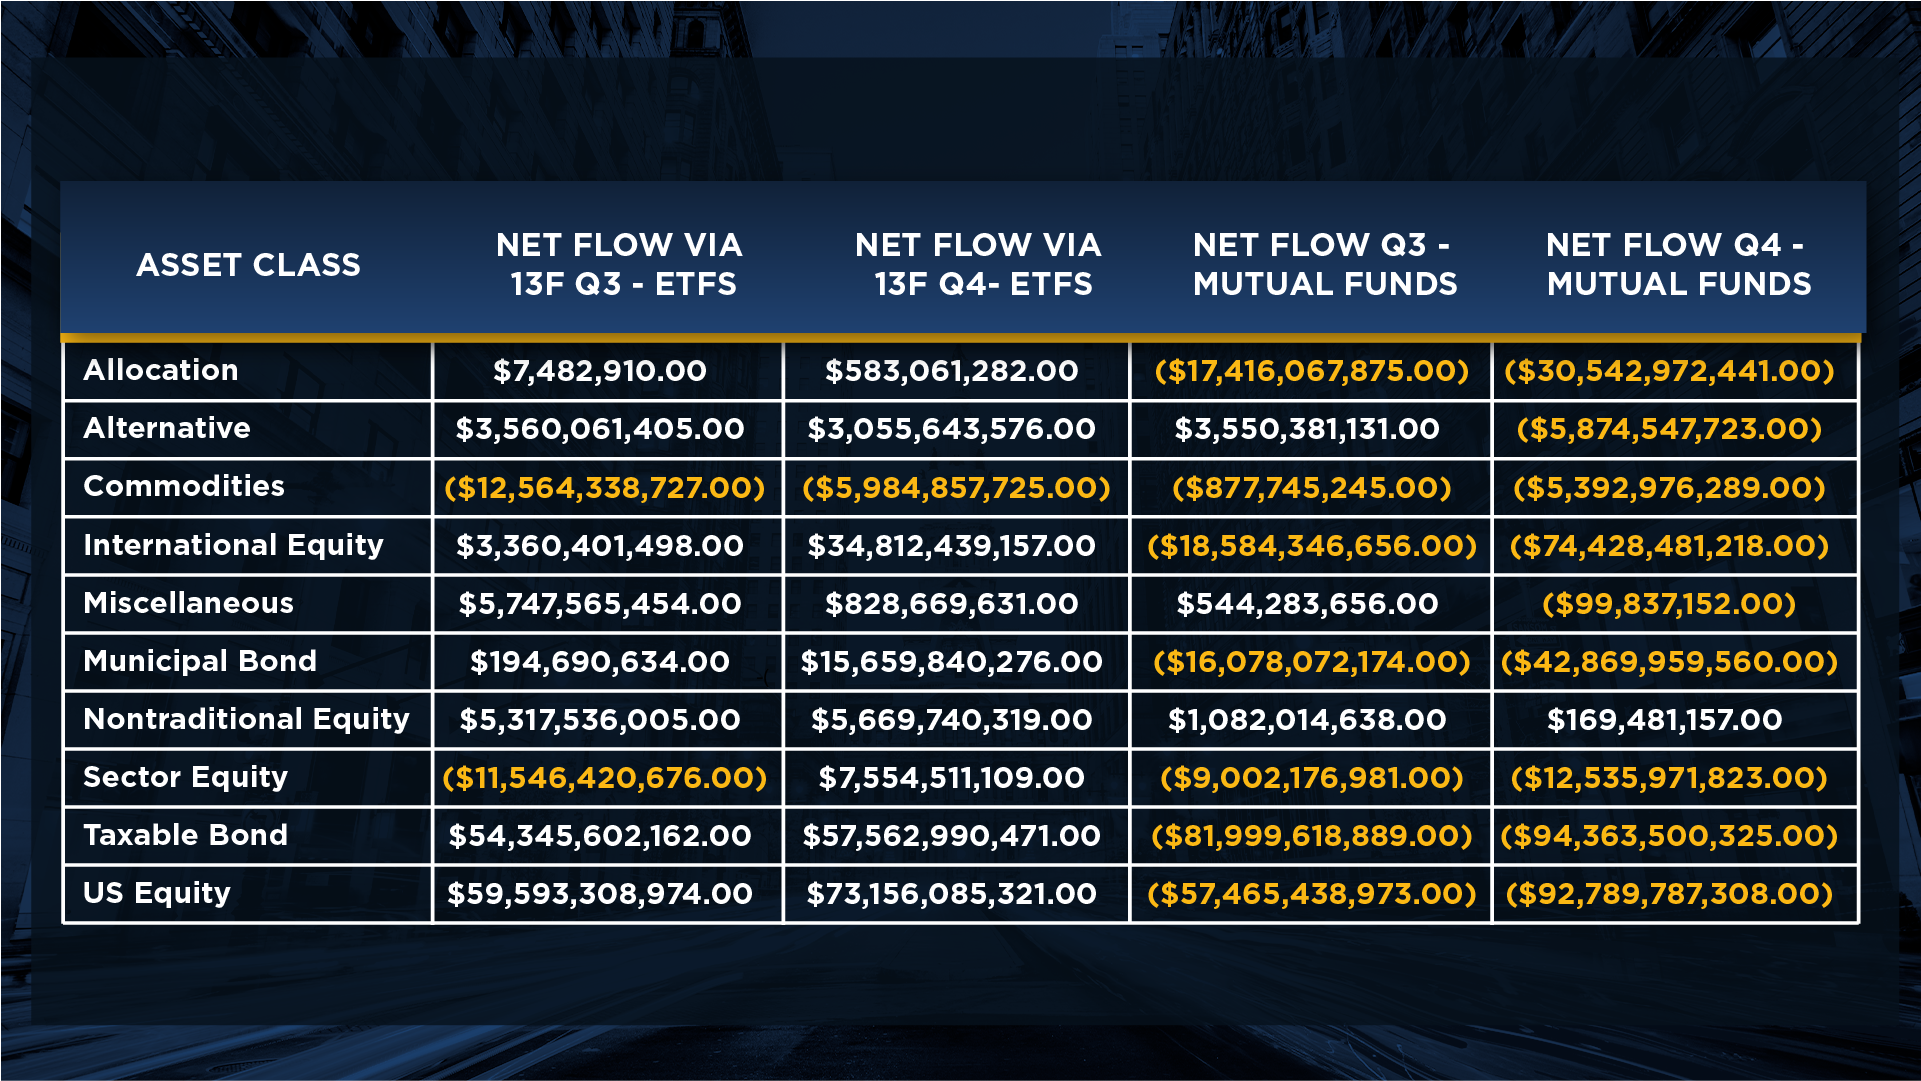
Under the surface of the data, a few trends stood out:
- Allocators continued to shift from equity mutual funds into equity ETFs with US equity and international ETFs gathering additional momentum over Q3.
- One of the factors behind the mutual fund to ETF switch was that approximately 68% of equity funds paid cap gains in 2022 and allocators shifted to ETFs to avoid these cap gains. We will be watching the Q1 13F data to see if this reversed at all.
- Commodity fund outflows slowed a bit as allocators are trying to find the best way to play real assets moving forward: oil, slowing developed econ growth, Ukraine and China reopening all being factors.
- Sector specific equities had a MAJOR reversal led by healthcare, energy, tech and global real estate inflows.
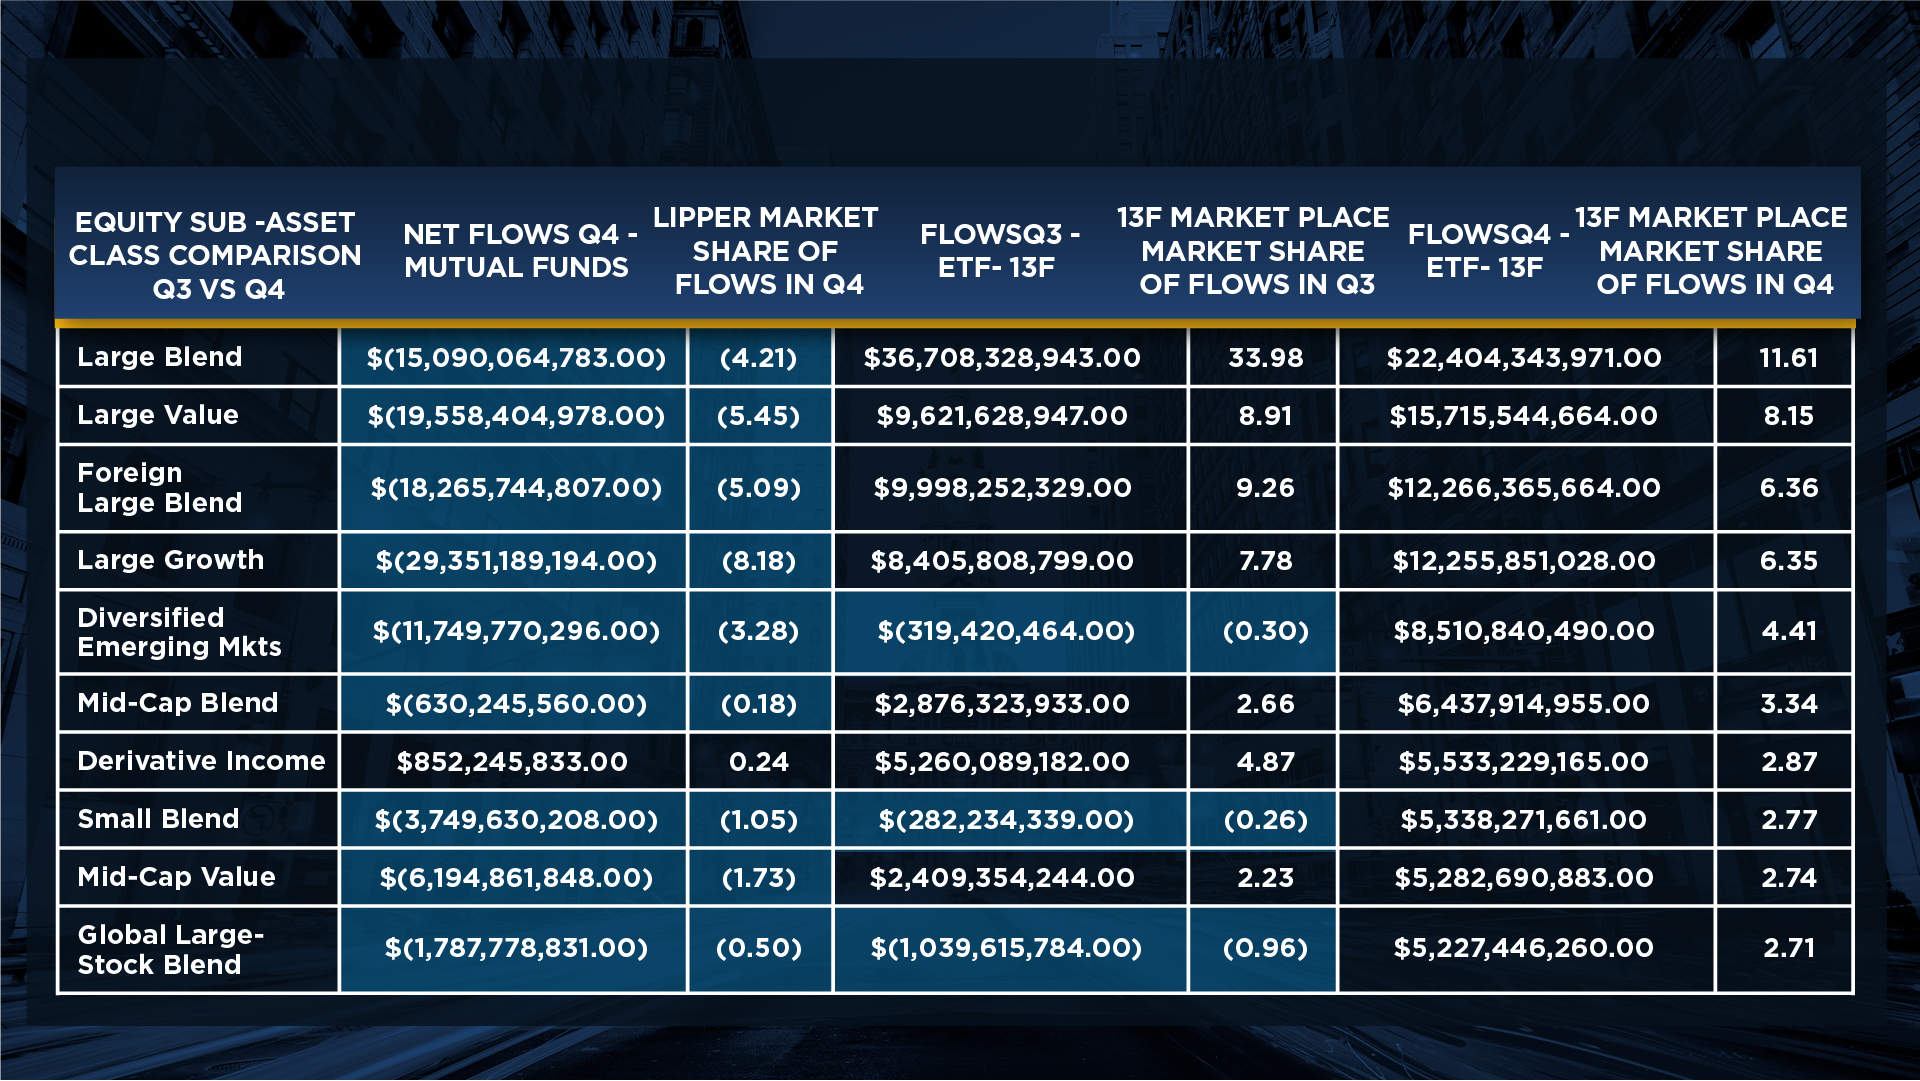
Looking across the 13F equity sub-asset classes and then comparing the structure specific data was the most interesting data:
- At the end of Q3 2022 over 52% of all equity ETF flows were captured across only three sub-asset classes. At the end of Q4 2022, this broadened out to 52% of all equity flows being captured across ten sub-asset classes. This broadening out in flows showed us that allocators were no longer “crowding” into one factor, a healthy trend for the overall market.
- A very pronounced increase in ETF allocations into the large value, foreign large blend, and EME. Mutual Funds however did not see similar trends as net outflows continued. We have noted on our pension commitment updates that EME has also been an area getting allocations from pensions for the past two quarters.
- Covered call strategies continue to receive consistent allocations within the alternatives as allocators look to generate more income from their equities, even in the face of higher front end rates.
- While we continue to see Active ETF launches and allocator surveys hi-light this as a growth area, this has not translated into flows from allocators. The covered call and large blend categories continue to attract the majority of allocations.
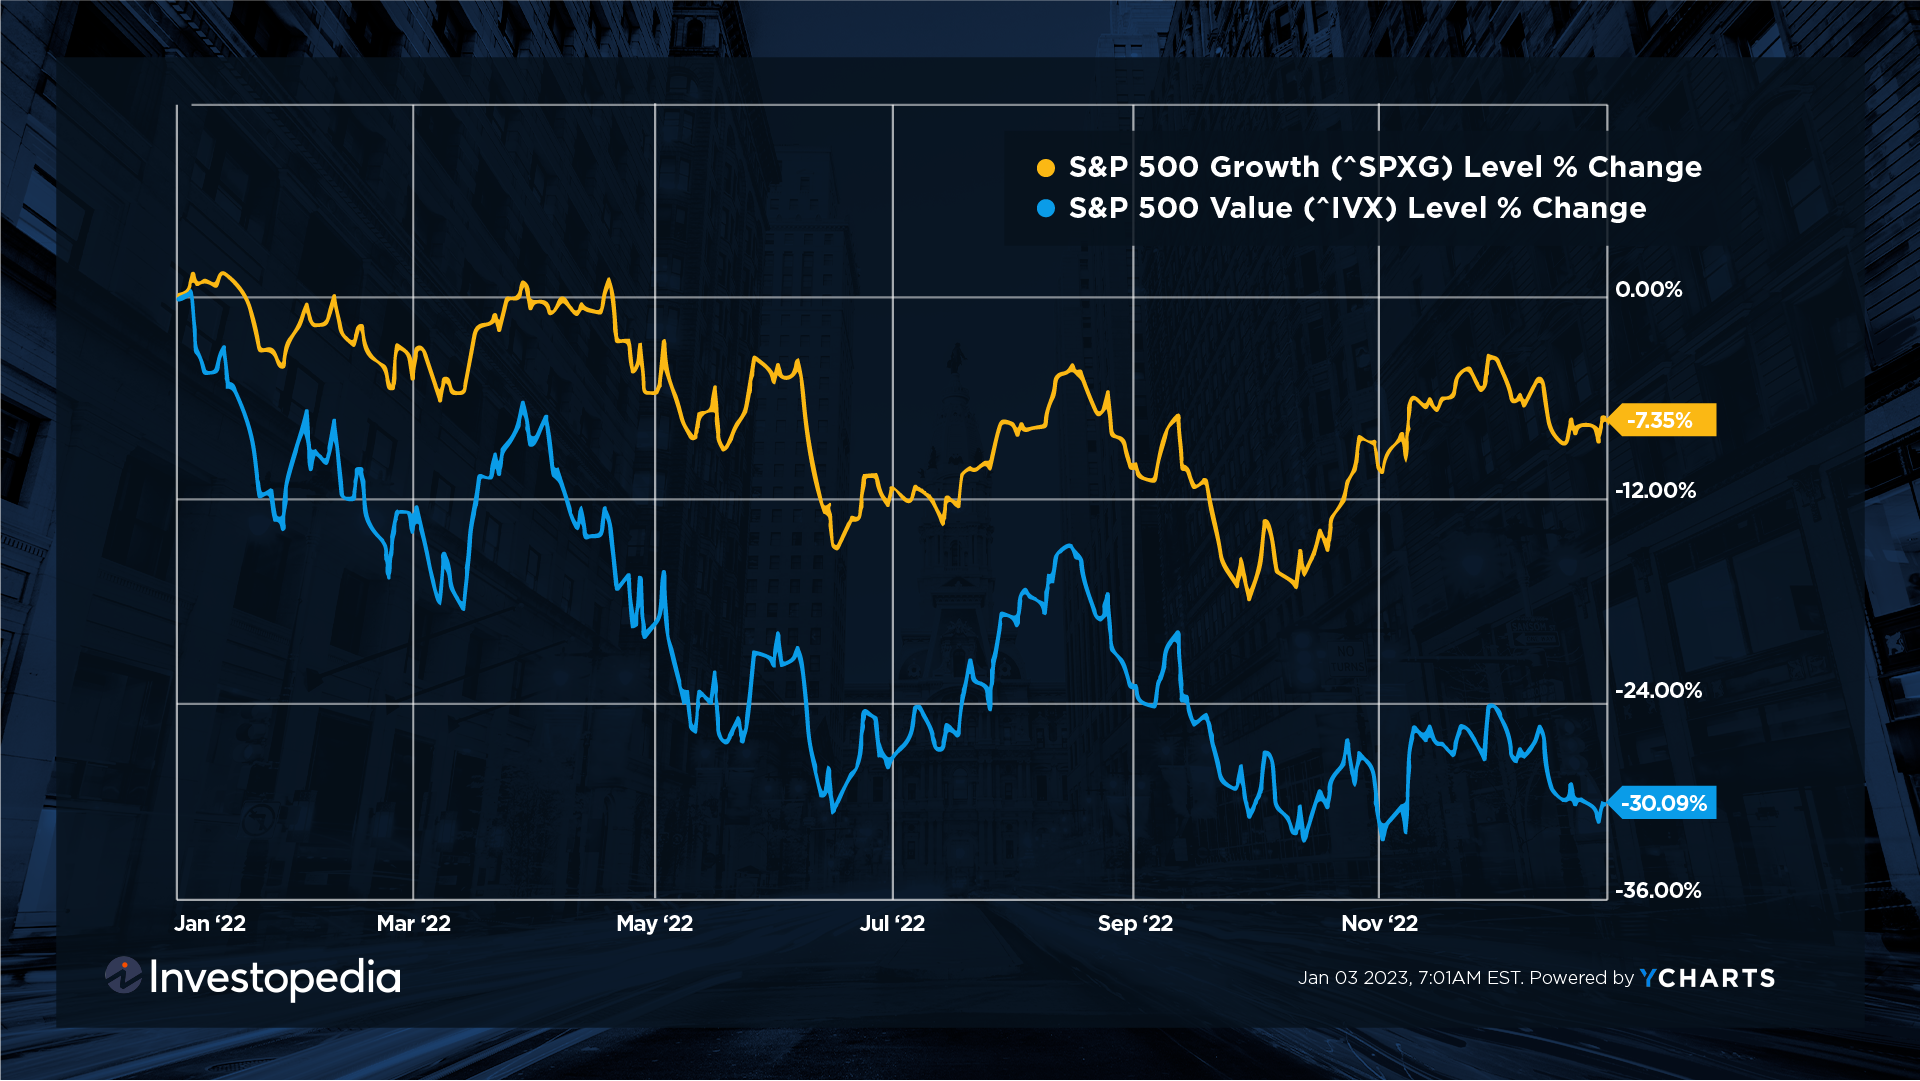
- Large cap growth captured over 6% of ETF flows in Q4, however this was not enough to overcome the net outflows from mutual funds, losing net -$3 billion in Q4 for the category as whole due to the tax-loss opportunity which accelerated in Q4.
For more information on 13Fs register for our next Dakota Live! Call.


