Our last 13F update we reviewed the ETF product landscape and ETF flows trends which we saw occur among allocators via MarketPlace during 2022. Capping off the asset class flows we observed for Q4 2022, all allocators were operating in an market that now has the highest Fed Funds rate we have seen in 15 years.
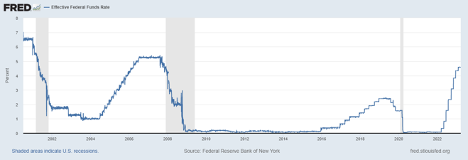
This adjustment has also occurred at the fastest pace investors have ever seen within a 12 month period. As we looked at Q4 13F data, we saw allocators begin to look toward the possible end of the fixed income yield and equity multiple adjustments they were positioning for earlier in the year.
Chart 2
|
ETF-Asset Class
|
Q3-2022
|
% of flows
|
Q4-2022
|
% of flows
|
|
US Equity
|
59,600,266,731
|
55%
|
64,039,588,500
|
32%
|
|
Taxable Bond
|
54,301,000,000
|
50%
|
57,850,253,800
|
29%
|
|
Municipal Bond
|
198,600,000
|
1%
|
15,559,840,277
|
8%
|
|
Alternative
|
3,510,200,000
|
3.10%
|
3,010,050,276
|
1.57%
|
|
Commodities
|
-(12,100,320,000)
|
-11.30%
|
-(5,884,857,725)
|
-0.03
|
|
Sector Specific Equity
|
-(11,510,366,000)
|
-10%
|
7,556,018,176
|
-0.039
|
|
Leveraged-Trading
|
5,740,560,465
|
5%
|
828,668,630
|
0.43
|
|
Intl Equity
|
3,400,282,000
|
3%
|
7,556,018,178
|
18%
|
All through 2022 we had seen two major themes: US equity and US fixed income took the majority of the flows at 45% each, and second, passive ETF flows continued to grow in both equities and fixed income VS passive. In Q4, this trend reversed. Flows to passive US Equities ETFs dropped by over 20%, as did flows to passive Fixed Income. While active ETFs in both categories grew, especially in active Fixed Income ETFs in Q4 as they grew over $3B in net flows. It is also worth noting as we reviewed Q4 Lipper Fund data, that the year long trend of active mutual funds losing assets to passive mutual funds also reversed as the share of actively managed assets had a slight increase during Q4 vs passive funds.
Taking the market impact into account, the total net ETF assets tracked via 13Fs during the 4th quarter increased approximately 10% from $5.9 trillion in Q3 to Q4 at $6.528 Trillion, with active ETFs at 5.5% of total assets despite having 1026 active ETF strategies. Some additional observations:
- While US equity flows dropped, we saw a massive uptick in international equity flows increasing 15%
- Muni bonds increase flows by over 7% , mainly in short term Munis
- Alts and leveraged trading ETFs saw a decrease in interest as flows have flatlined
- Commodity related ETFs again saw a large decrease in net flows as global commodity supply fears continue to moderate VS this time last year, however the outflows are moderating
Chart 3
|
Sub -Asset Class Flows of Note
|
Q2-2022
|
% of flows
|
Q3-2022
|
% of flows
|
|
Allocation Funds
|
16,900,757
|
-1.00%
|
584,170,300
|
1.00%
|
|
Emerging Market Equity
|
-(14,670,050,800)
|
-1.00%
|
8,502,800,420
|
4.50%
|
|
Global Large Blend
|
-(1,027,003,222)
|
-2.00%
|
5,210,677,997
|
3.00%
|
|
Global Listed Real Estate
|
-(56,370,901)
|
-0.03%
|
520,890,400
|
0.50%
|
|
Small Cap Blend Equity
|
-(281,411,200)
|
-2.60%
|
5,254,800,000
|
-3.00%
|
|
Preferreds
|
-(238,100,400)
|
-0.20%
|
-(1,101,225,081)
|
-1.50%
|
|
Muni Bonds-int term
|
9,236,000,000
|
9.10%
|
94,250,220
|
0.10%
|
|
EM Bonds-local and USD
|
-(3,587,368)
|
-1.00%
|
891,411,600
|
2.00%
|
Similar to last quarter, the flows we saw via 13 ETF data were not mirrored in mutual funds as Lipper reported continued net outflows in all major asset classes. For an asset manager, this underscores why it is important to look at all vehicles for each addressable asset class as they may tell a different story depending on the vehicle being used by allocators.
Looking under the hood at the sub-asset classes there were some trends of note:
- Active and passive allocation ETFs saw the first positive flows of the year. With many moving away from blended portfolios for the past year, we started to see some move back toward stock/bond blends again. This corroborates with the flatness in Alternative flows we saw.
- Sector wise, global real estate/REITs swung to positive for the first time this year.
- EM equities had a massive flip to positive during the quarter. We have noted allocations made by pension funds via our Public Pension Notes to EME all during the year, now we are seeing this trend extend to retail allocators
- EM debt also saw a flip to positive flows for the first time in 2022, bent toward EM Local Debt as local tends to outperform in flat to down USD markets.
- Preferred fixed income experienced outflows in Q4 as their duration exposure made them a target for year end tax loss selling. We will monitor them going into Q1 2023 as investor continue to look for income.