Q2 13F ETF Flow Comparison By Sub-Asset Class

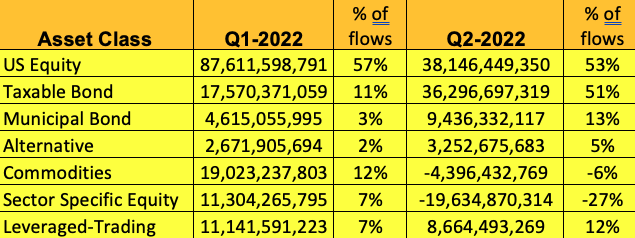
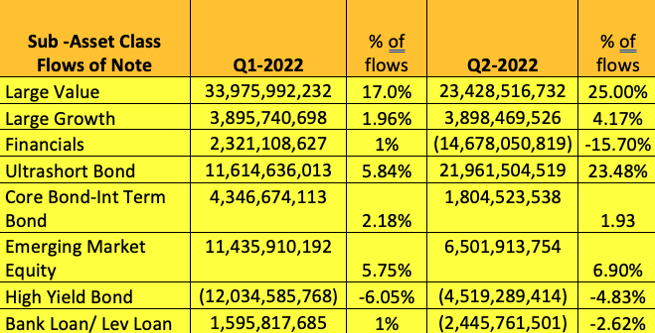
During Q2 the 13-F trends we saw from an asset class/sub asset class level were contrary to what the headline news would have led us to believed. Even with the volatility the fact that equities in general maintained over 50% share of ETF flows was impressive and within equities, value bent equities were favored.


Fixed income showed the largest gain as rising yields made the asset class attractive again for allocators, more specifically ultra-short/short duration is where we saw the highest sub-asset class flows.


Where did we see a large decrease? Commodities by far showed the largest reversal quarter over quarter as some of the Russia/Ukraine headlines fell off bringing agriculture prices down. That said, we did see flows continue in the energy sub-asset class exposed to oil and natural gas.


A trend that we also saw in the Q2 reports was an in an increase in interval funds as a product structure. This vehicle allows many asset managers bring alternatives and asset classes that are meant to be a bit more illiquid, to a broader investment base. In the interval funds that we can track, we have seen flows go into income and real estate-oriented strategies run by Cliffwater, Bluerock, Apollo, and Pimco attracting the most assets during the quarter.


The below tables are a comparison of the filings tracked via asset class and sub-asset class and the percentage of net flows during the comparable quarters:


Screen Shot 2022-10-24 at 1.35.17 PM


Screen Shot 2022-10-24 at 1.33.21 PM


For more information, click below for a free trial of Marketplace.New call-to-action

Written By: Gui Costin, Founder, CEO

Gui Costin is the Founder and CEO of Dakota.

logo-1

The leading intelligence platform on institutional and RIA data